
Financial Statements
Examples of common numeric unitsNumeric units such as scale and precision define the size and decimal postition (rounding) of an XBRL tag. for each financial statement are shown below.
Document and Entity Information "DEI"
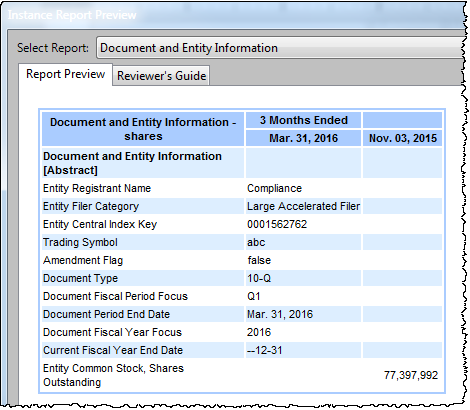
Entity Common Stock, Shares Outstanding
- Digits As Shown – applied to the row
- Shares - Note that the shares tagA tag renders a value in XBRL, made up of an element, a calendar, numeric units and a member, if needed. is automatically applied by DM Word, since the data type of the elementThe representation of a financial reporting concept, including: line items in the face of the financial statements, important narrative disclosures, and rows and columns in tables. is shares. No additional tagging in the grid is required.
Currency Per Share Tags
The most common currency per share tag (USD/shares) is included by default in the numeric units pane, under Calculated > Calculated Items.
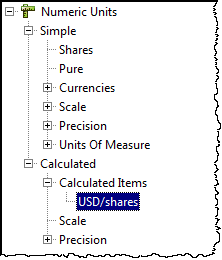
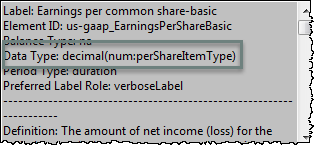
This tag is applied anytime the element applied has a data type of perShareItemType.
The USDEPS tag is unique in that it can be applied to any row or column, and DM Word will only apply the tag to those values which are also tagged with a data yype of perShare. There is no risk of over-applying the tag. For this reason, Certent’s standard practice is to apply this tag to columns, or rows when appropriate.
In the rare situation where a per share tag is needed for a different currency (e.g., earnings in British pounds per share), this new numeric unit tag could be created.
To create a calculated unit:
- Right click on Calculated Items, and select Add Unit.
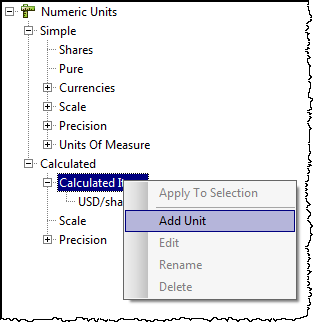
- In the Numeric Units window, make the appropriate field selections, then click OK.
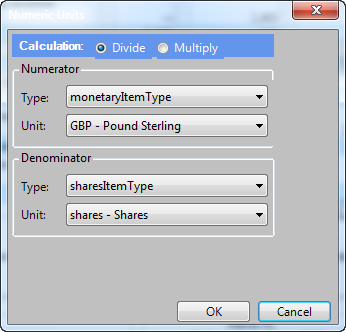
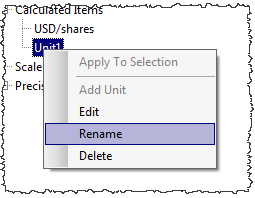
- The new Calculated Item appears in the Numeric Units list. Right click on the item to rename it.
Income Statement
(In millions, except per share amounts)
|
Earnings per share: |
||||
| Basic and diluted | 0.30 | 0.38 | 1.03 | 0.99 |
|
Shares used in computing net income per share: |
||||
| Basic | 125.5 | 128.4 | 125.4 | 130.3 |
| Diluted | 126.3 | 128.8 | 125.8 | 130.4 |
Earnings Per Share
- Calculated – USDEPS – applied to the column
- Precision – Hundredth – applied to the row
- Scale – One (no scale)
Weighted average shares (both the Basic and Diluted lines):
- Scale – Millions – applied to the row
- Precision – Hundred thousand – applied to the row
- Shares – Note that the shares tag is automatically applied since the data type of the element is shares. No additional tagging in the grid is required.
Income Statement: Earnings Per Share
(In millions, except per share amounts)
| Earnings Per Share - Basic and diluted-1st case | $1 |
| Earnings Per Share - Basic and diluted-2nd case | $1.09 |
| Earnings Per Share - Basic and diluted-3rd case | $1.00 |
| Earnings Per Share - Basic and diluted-4th case | $.999 |
For all cases, apply USDEPS to the column and the following precisions to the row:
1st Case – Whole number
2nd Case – Hundredth
3rd Case – Hundredth
4th Case – Thousandth
Income Statement: Shares
(In millions, except per share amounts)
|
Shares used in computing net income per share: |
||||
| Basic | 125 | 128 | 125 | 130 |
| Diluted | 126 | 129 | 126 | 131 |
- Scale – Millions– applied to the row
- Precision – Million (6) – applied to the row
- Shares - Share tag is automatically applied since the data type of the element is shares. Therefore, tagging with shares in the grid is not required.
Income Statement: Dividends Per Share $0.32
Dividend per share – $0.32
- Calculated – USDEPS – applied to the column
- Precision –Digits As Shown – applied to the row
- Scale - One (no scale)
Income Statement: Dividends Per Share $1
Dividend per share – $1
- Calculated – USDEPS – applied to the column
- Precision –Digits As Shown– applied to the row
- Scale – One (no scale)
Balance Sheet (Parenthetical)
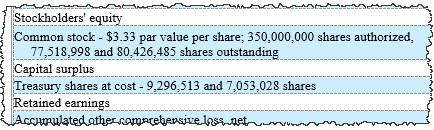
Balance sheet parenthetical details are tagged by highlighting the values in the document and using View Tagging Paragraph. Generally per share and share information in the balance sheet parenthetical are tagged with:
- Precision – Digits as Shown
- Calculated – USDEPS applied to values that are per share
Shareholders Equity Statement
(in thousands)
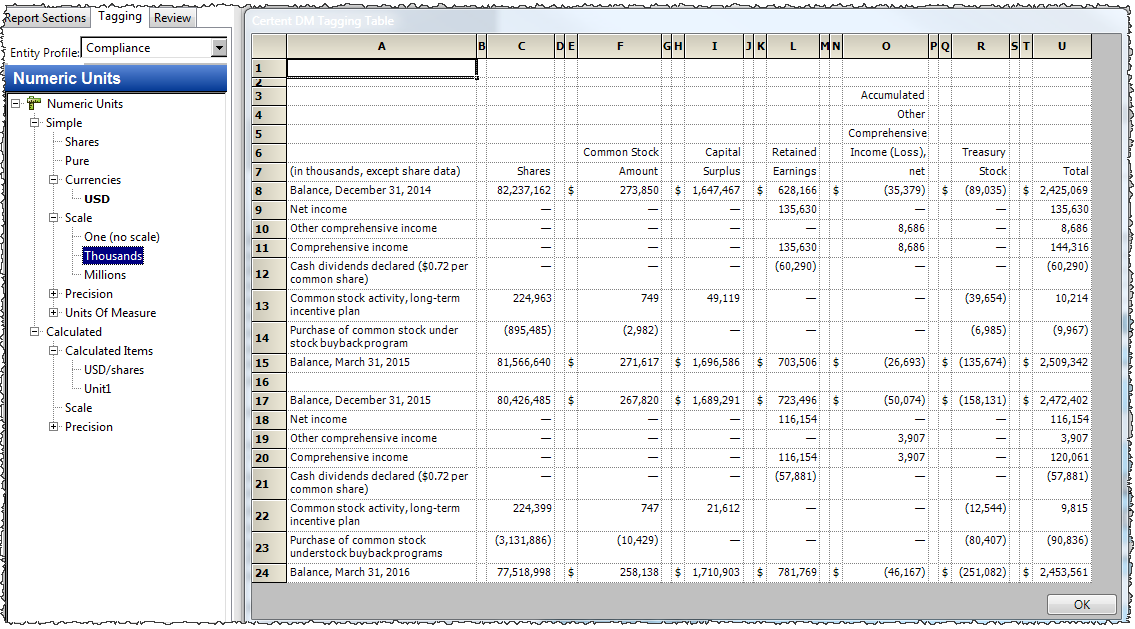
- Scale – Tag all monetary columns with Thousands
- Precision – Tag shares column with No Scale and Digits as Shown (INF) because the heading of the table states in thousands, except share data. The default precision of Thousand (3) from the entity is appropriate for monetary amounts, so no additional precision tag is needed.
Next: Percentage Values
Rev: 7/5/17
Copyright © 2021 Certent